Ensembles as teachers
Is an ensemble of teachers a better target than one? Average logits or average probabilities?
Methods: Ensemble teachers
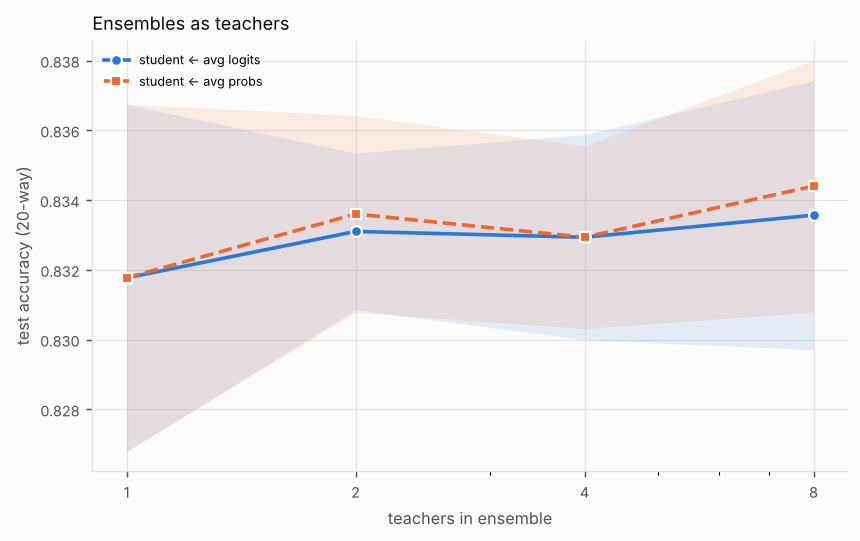
This figure did not load: the file is missing or the connection dropped. Reload the page to try again; the table below has the same numbers.
Table
Mean over the seeds; ± is the standard deviation where more than one seed ran. The experiment took 32 s.
| Teachers in ensemble | Method | Ensemble accuracy | Test accuracy (20-way) | Target-class AP ('bird') | Test NLL | KL(Bayes || model) | Parameters (nonzero) |
|---|---|---|---|---|---|---|---|
| 1 | student <- avg logits | 0.914 ± 0.000 | 0.832 ± 0.005 | 0.954 ± 0.005 | 0.511 ± 0.013 | 0.433 ± 0.015 | 2,132 |
| 1 | student <- avg probs | 0.914 ± 0.000 | 0.832 ± 0.005 | 0.954 ± 0.005 | 0.511 ± 0.013 | 0.433 ± 0.015 | 2,132 |
| 1 | (ensemble itself) | 0.914 | |||||
| 2 | student <- avg logits | 0.922 ± 0.000 | 0.833 ± 0.002 | 0.955 ± 0.006 | 0.508 ± 0.010 | 0.430 ± 0.011 | 2,132 |
| 2 | student <- avg probs | 0.922 ± 0.000 | 0.834 ± 0.003 | 0.956 ± 0.005 | 0.507 ± 0.012 | 0.429 ± 0.013 | 2,132 |
| 2 | (ensemble itself) | 0.922 | |||||
| 4 | student <- avg logits | 0.926 ± 0.000 | 0.833 ± 0.003 | 0.955 ± 0.005 | 0.505 ± 0.010 | 0.427 ± 0.012 | 2,132 |
| 4 | student <- avg probs | 0.926 ± 0.000 | 0.833 ± 0.003 | 0.955 ± 0.005 | 0.506 ± 0.010 | 0.428 ± 0.011 | 2,132 |
| 4 | (ensemble itself) | 0.926 | |||||
| 8 | student <- avg logits | 0.926 ± 0.000 | 0.834 ± 0.004 | 0.956 ± 0.006 | 0.504 ± 0.010 | 0.426 ± 0.012 | 2,132 |
| 8 | student <- avg probs | 0.926 ± 0.000 | 0.834 ± 0.004 | 0.956 ± 0.005 | 0.503 ± 0.009 | 0.426 ± 0.011 | 2,132 |
| 8 | (ensemble itself) | 0.926 |
Reference points
- Teacher (the large model)
- The full-size network trained on the labeled data; the smaller models here are measured against it. Test accuracy (20-way) 0.914, target-class AP ('bird') 0.989, test NLL 0.384, KL(Bayes || model) 0.309, parameters (nonzero) 140,052.
- Bayes-optimal (the best any model can do on this problem)
- Predictions from the exact class probabilities, which the lab can compute because it generated the data. Test accuracy (20-way) 0.973, target-class AP ('bird') 0.999, test NLL 0.079.
Birds in this experiment
The table's 6 smaller models hatch 1 kind of bird. Each kind is drawn once, for one model: the smallest if the bird is healthy or bones, the one that keeps the most if it's starving. Rows with the same size and score count as one model.
- Ruby-throated Hummingbird, starvingTeachers in ensemble: 8; method: student <- avg probs65.6× smaller, keeps 91.3% of the teacher's accuracyBest of 6 models
Measured against this experiment's teacher: 140,052 parameters, 4481.7 kbit, accuracy 0.914. Storage is 32 bits a parameter, the lab's rule for a dense fp32 net, which every model drawn here is. Species follows how many times smaller a model is. A bird stays healthy while its model keeps at least 95% of the reference's score, and turns to bones at 60% or less.
These are the lab's recorded results, so they aren't added to anyone's life list. Birds you hatch yourself, in the Coop or from a Field Guide run, are saved to your life list.