Low-rank factorization (SVD)
Replace each 256x256 matrix with a rank-r product. How low can r go, and how does it compare per-parameter with deleting neurons?
Methods: Low-rank factorization (SVD)
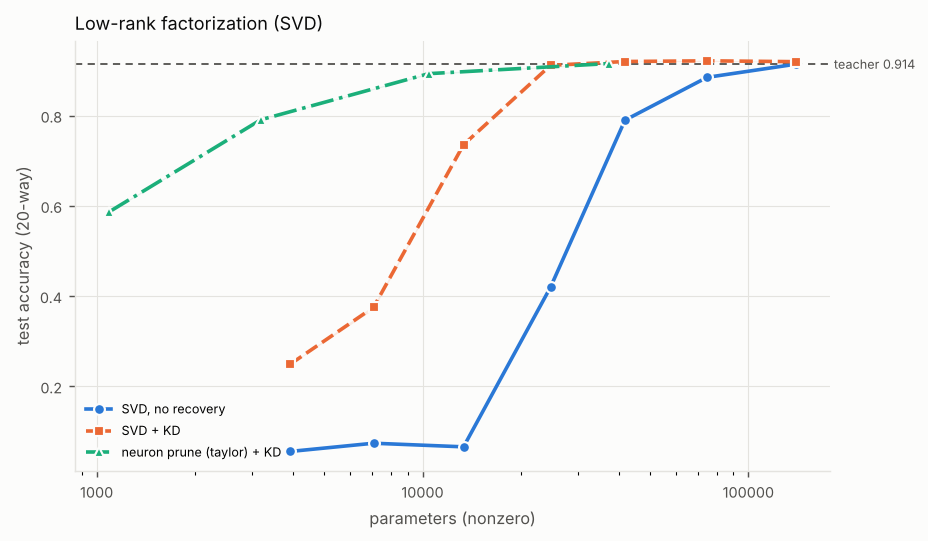
This figure did not load: the file is missing or the connection dropped. Reload the page to try again; the table below has the same numbers.
Table
Mean over the seeds; ± is the standard deviation where more than one seed ran. The experiment took 85 s.
| Rank / width | Method | Test accuracy (20-way) | Target-class AP ('bird') | Test NLL | KL(Bayes || model) | Parameters (nonzero) |
|---|---|---|---|---|---|---|
| 128 | SVD, no recovery | 0.914 | 0.989 | 0.384 | 0.309 | 140,052 |
| 128 | SVD + KD | 0.919 ± 0.000 | 0.989 ± 0.000 | 0.306 ± 0.001 | 0.227 ± 0.001 | 140,052 |
| 64 | SVD, no recovery | 0.885 | 0.983 | 0.486 | 0.411 | 74,644 |
| 64 | SVD + KD | 0.921 ± 0.002 | 0.990 ± 0.000 | 0.292 ± 0.002 | 0.215 ± 0.002 | 74,644 |
| 32 | SVD, no recovery | 0.790 | 0.960 | 0.916 | 0.836 | 41,812 |
| 32 | SVD + KD | 0.920 ± 0.000 | 0.990 ± 0.000 | 0.292 ± 0.001 | 0.217 ± 0.001 | 41,812 |
| 16 | SVD, no recovery | 0.420 | 0.548 | 3.982 | 3.888 | 24,708 |
| 16 | SVD + KD | 0.911 ± 0.000 | 0.986 ± 0.000 | 0.301 ± 0.001 | 0.226 ± 0.001 | 24,708 |
| 8 | SVD, no recovery | 0.066 | 0.078 | 7.020 | 6.932 | 13,364 |
| 8 | SVD + KD | 0.735 ± 0.002 | 0.928 ± 0.002 | 0.819 ± 0.000 | 0.744 ± 0.000 | 13,364 |
| 4 | SVD, no recovery | 0.074 | 0.065 | 3.576 | 3.492 | 7,076 |
| 4 | SVD + KD | 0.375 ± 0.004 | 0.659 ± 0.004 | 1.833 ± 0.014 | 1.749 ± 0.014 | 7,076 |
| 2 | SVD, no recovery | 0.056 | 0.056 | 3.130 | 3.046 | 3,932 |
| 2 | SVD + KD | 0.249 ± 0.000 | 0.571 ± 0.008 | 2.240 ± 0.000 | 2.155 ± 0.000 | 3,932 |
| 128 | neuron prune (taylor) + KD | 0.915 ± 0.001 | 0.990 ± 0.000 | 0.285 ± 0.001 | 0.204 ± 0.001 | 37,268 |
| 64 | neuron prune (taylor) + KD | 0.893 ± 0.002 | 0.981 ± 0.000 | 0.321 ± 0.000 | 0.245 ± 0.000 | 10,452 |
| 32 | neuron prune (taylor) + KD | 0.791 ± 0.000 | 0.944 ± 0.002 | 0.636 ± 0.002 | 0.554 ± 0.002 | 3,188 |
| 16 | neuron prune (taylor) + KD | 0.587 ± 0.002 | 0.799 ± 0.002 | 1.242 ± 0.007 | 1.162 ± 0.007 | 1,092 |
Reference points
- Teacher (the large model)
- The full-size network trained on the labeled data; the smaller models here are measured against it. Test accuracy (20-way) 0.914, target-class AP ('bird') 0.989, test NLL 0.384, KL(Bayes || model) 0.309, parameters (nonzero) 140,052.
- Bayes-optimal (the best any model can do on this problem)
- Predictions from the exact class probabilities, which the lab can compute because it generated the data. Test accuracy (20-way) 0.973, target-class AP ('bird') 0.999, test NLL 0.079.
Birds in this experiment
The table's 16 smaller models hatch 9 kinds of bird. Each kind is drawn once, for one model: the smallest if the bird is healthy or bones, the one that keeps the most if it's starving.
- Mourning Dove, healthyRank / width: 32; method: SVD + KD3.3× smaller, scores 100.6% of the teacher's accuracyBest of 3 models
- Mourning Dove, starvingRank / width: 32; method: SVD, no recovery3.3× smaller, keeps 86.4% of the teacher's accuracyThe only model of its kind
- Common Swift, healthyRank / width: 16; method: SVD + KD5.6× smaller, keeps 99.7% of the teacher's accuracyBest of 2 models
- Common Swift, skeletonRank / width: 16; method: SVD, no recovery5.6× smaller, keeps 45.9% of the teacher's accuracyThe only model of its kind
- Barn Swallow, healthyRank / width: 64; method: neuron prune (taylor) + KD13.3× smaller, keeps 97.7% of the teacher's accuracyThe only model of its kind
- Barn Swallow, starvingRank / width: 8; method: SVD + KD10.4× smaller, keeps 80.5% of the teacher's accuracyThe only model of its kind
- Barn Swallow, skeletonRank / width: 8; method: SVD, no recovery10.4× smaller, keeps 7.2% of the teacher's accuracyThe only model of its kind
- Ruby-throated Hummingbird, starvingRank / width: 32; method: neuron prune (taylor) + KD43.9× smaller, keeps 86.5% of the teacher's accuracyBest of 2 models
- Ruby-throated Hummingbird, skeletonRank / width: 2; method: SVD, no recovery35.6× smaller, keeps 6.1% of the teacher's accuracyBest of 4 models
Measured against this experiment's teacher: 140,052 parameters, 4481.7 kbit, accuracy 0.914. Storage is 32 bits a parameter, the lab's rule for a dense fp32 net, which every model drawn here is. Species follows how many times smaller a model is. A bird stays healthy while its model keeps at least 95% of the reference's score, and turns to bones at 60% or less.
These are the lab's recorded results, so they aren't added to anyone's life list. Birds you hatch yourself, in the Coop or from a Field Guide run, are saved to your life list.