Temperature x KD-weight grid
Which temperature T and what mix of KD vs. ground-truth CE (alpha) works best when the student only sees the labeled set?
Methods: Knowledge distillation (Hinton)
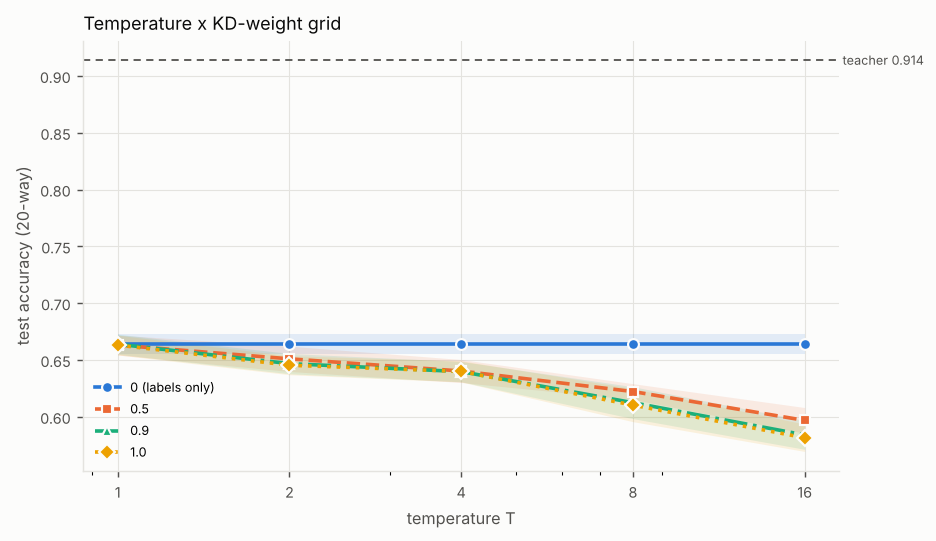
This figure did not load: the file is missing or the connection dropped. Reload the page to try again; the table below has the same numbers.
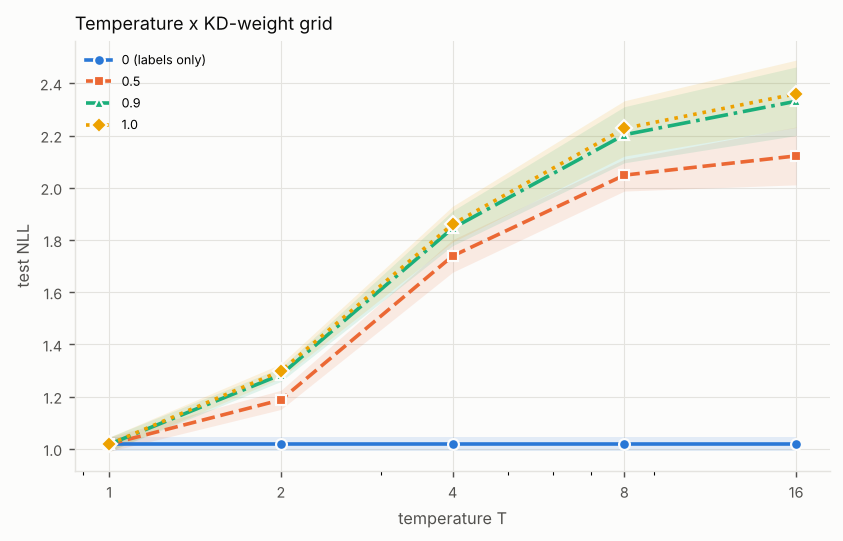
This figure did not load: the file is missing or the connection dropped. Reload the page to try again; the table below has the same numbers.
Table
Mean over the seeds; ± is the standard deviation where more than one seed ran. The experiment took 112 s.
| Temperature T | Alpha | Test accuracy (20-way) | Target-class AP ('bird') | Agreement with teacher | Test NLL | KL(Bayes || model) | Parameters (nonzero) |
|---|---|---|---|---|---|---|---|
| 1 | 0 (labels only) | 0.664 ± 0.009 | 0.843 ± 0.005 | 0.674 ± 0.010 | 1.018 ± 0.027 | 0.936 ± 0.028 | 820 |
| 1 | 0.5 | 0.663 ± 0.009 | 0.844 ± 0.005 | 0.674 ± 0.010 | 1.018 ± 0.028 | 0.936 ± 0.029 | 820 |
| 1 | 0.9 | 0.664 ± 0.009 | 0.839 ± 0.003 | 0.675 ± 0.010 | 1.017 ± 0.027 | 0.936 ± 0.028 | 820 |
| 1 | 1.0 | 0.663 ± 0.009 | 0.839 ± 0.003 | 0.673 ± 0.010 | 1.018 ± 0.027 | 0.936 ± 0.028 | 820 |
| 2 | 0 (labels only) | 0.664 ± 0.009 | 0.843 ± 0.005 | 0.674 ± 0.010 | 1.018 ± 0.027 | 0.936 ± 0.028 | 820 |
| 2 | 0.5 | 0.651 ± 0.011 | 0.841 ± 0.007 | 0.663 ± 0.011 | 1.188 ± 0.037 | 1.105 ± 0.040 | 820 |
| 2 | 0.9 | 0.647 ± 0.009 | 0.839 ± 0.012 | 0.658 ± 0.010 | 1.284 ± 0.026 | 1.201 ± 0.028 | 820 |
| 2 | 1.0 | 0.645 ± 0.008 | 0.839 ± 0.011 | 0.657 ± 0.010 | 1.298 ± 0.027 | 1.215 ± 0.029 | 820 |
| 4 | 0 (labels only) | 0.664 ± 0.009 | 0.843 ± 0.005 | 0.674 ± 0.010 | 1.018 ± 0.027 | 0.936 ± 0.028 | 820 |
| 4 | 0.5 | 0.640 ± 0.010 | 0.845 ± 0.010 | 0.652 ± 0.009 | 1.739 ± 0.062 | 1.658 ± 0.061 | 820 |
| 4 | 0.9 | 0.640 ± 0.009 | 0.843 ± 0.012 | 0.652 ± 0.008 | 1.845 ± 0.067 | 1.765 ± 0.068 | 820 |
| 4 | 1.0 | 0.640 ± 0.009 | 0.843 ± 0.013 | 0.651 ± 0.008 | 1.861 ± 0.069 | 1.780 ± 0.070 | 820 |
| 8 | 0 (labels only) | 0.664 ± 0.009 | 0.843 ± 0.005 | 0.674 ± 0.010 | 1.018 ± 0.027 | 0.936 ± 0.028 | 820 |
| 8 | 0.5 | 0.622 ± 0.007 | 0.830 ± 0.026 | 0.637 ± 0.006 | 2.048 ± 0.061 | 1.962 ± 0.063 | 820 |
| 8 | 0.9 | 0.612 ± 0.014 | 0.825 ± 0.024 | 0.628 ± 0.013 | 2.203 ± 0.107 | 2.114 ± 0.109 | 820 |
| 8 | 1.0 | 0.610 ± 0.015 | 0.824 ± 0.022 | 0.627 ± 0.014 | 2.227 ± 0.106 | 2.138 ± 0.108 | 820 |
| 16 | 0 (labels only) | 0.664 ± 0.009 | 0.843 ± 0.005 | 0.674 ± 0.010 | 1.018 ± 0.027 | 0.936 ± 0.028 | 820 |
| 16 | 0.5 | 0.597 ± 0.011 | 0.815 ± 0.031 | 0.614 ± 0.013 | 2.122 ± 0.111 | 2.033 ± 0.115 | 820 |
| 16 | 0.9 | 0.584 ± 0.013 | 0.811 ± 0.026 | 0.601 ± 0.013 | 2.331 ± 0.131 | 2.239 ± 0.136 | 820 |
| 16 | 1.0 | 0.582 ± 0.012 | 0.811 ± 0.024 | 0.598 ± 0.012 | 2.360 ± 0.129 | 2.268 ± 0.134 | 820 |
Reference points
- Teacher (the large model)
- The full-size network trained on the labeled data; the smaller models here are measured against it. Test accuracy (20-way) 0.914, target-class AP ('bird') 0.989, test NLL 0.384, KL(Bayes || model) 0.309, parameters (nonzero) 140,052.
- Bayes-optimal (the best any model can do on this problem)
- Predictions from the exact class probabilities, which the lab can compute because it generated the data. Test accuracy (20-way) 0.973, target-class AP ('bird') 0.999, test NLL 0.079.
Birds in this experiment
The table's 15 smaller models hatch 1 kind of bird. Each kind is drawn once, for one model: the smallest if the bird is healthy or bones, the one that keeps the most if it's starving. Rows with the same size and score count as one model.
- Ruby-throated Hummingbird, starvingTemperature T: 1; alpha: 0.9170.7× smaller, keeps 72.6% of the teacher's accuracyBest of 15 models
Measured against this experiment's teacher: 140,052 parameters, 4481.7 kbit, accuracy 0.914. Storage is 32 bits a parameter, the lab's rule for a dense fp32 net, which every model drawn here is. Species follows how many times smaller a model is. A bird stays healthy while its model keeps at least 95% of the reference's score, and turns to bones at 60% or less.
These are the lab's recorded results, so they aren't added to anyone's life list. Birds you hatch yourself, in the Coop or from a Field Guide run, are saved to your life list.